Cascadia Pharmacy
GLP-1 drug spend growth and immunization coverage analytics on real CMS + CDC public data.
Healthcare / Pharmacy Analytics
Cascadia Pharmacy
Turning messy federal public data — CMS Part D suppressed cells, CDC VaxView age-band mismatches — into a clean star schema and an interview-ready GLP-1 growth story.
Overview
A pharmacy-growth analytics stack built on real public data — CMS Medicare Part D drug spending and CDC adult immunization coverage — applying the Cascadia approach to healthcare. It’s also a deliberate showcase of cleaning messy, incomplete real-world data.
Business Problem
Two of the biggest growth areas in retail pharmacy are GLP-1 medications and immunization services. Both questions — where is GLP-1 spend going, and where are the immunization coverage gaps — live in public datasets that are real, valuable, and genuinely messy.
Architecture
Local SQL Server star schema → Power BI — a personal-scale build on public data, with no cloud lakehouse in the loop.
Source layer: CascadiaRx SQL Server star schema — 5 dimension tables + 2 fact tables.
fact_partd_drug_spend(339 rows, grain: drug × year 2020–2024, CMS Part D data)fact_immunization_coverage(24,596 rows, grain: vaccine × geography × demographic × season, CDC VaxView)
Staging: a Python raw → clean layer — currency-string parsing, drug-name normalization, and suppression handling; suppressed values are flagged, never zero-filled.
Semantic model + report: Power BI — the GLP-1 Growth Story page. An Immunization Coverage & Access page is a planned enhancement.
Data Sources
| Source | Type | Rows | Notes |
|---|---|---|---|
| CMS Medicare Part D Spending by Drug | Federal (CMS) | 14,536 raw → 339 filtered | Wide-format CSV, 2020–2024 annual columns; filtered to antidiabetic/obesity drug classes |
| CDC FluVaxView | Federal (CDC / Socrata) | 100K raw → 24,596 filtered | Adult flu vaccination coverage by state × age × season |
| CDC RSVVaxView | Federal (CDC) | TBD | Adult RSV coverage — planned enhancement |
| CDC COVIDVaxView | Federal (CDC) | TBD | Adult COVID coverage — planned enhancement |
Attribution: - CMS Part D data: Centers for Medicare & Medicaid Services — public domain federal data. - CDC VaxView: Centers for Disease Control and Prevention — public domain federal data.
Headline Skill: Cleaning Messy & Incomplete Data
Real government data isn’t clean: CMS suppresses small-cell counts (blanks/asterisks), spend arrives as currency strings, drug names vary in casing, and CDC suppresses or flags unstable estimates for small samples. The pipeline preserves that reality and handles it honestly — suppressed values are flagged, never silently zero-filled — and the report surfaces a “suppressed records” counter so the audience understands why a national total doesn’t equal the sum of states.
Key Findings
- GLP-1 medications are the standout growth story in Medicare Part D: class spend roughly tripled from ~$7B (2020) to $22B+ (2023) — about $54B cumulative over 2020–2023, with the latest year up ~70% YoY.
- The growth is driven by both volume and cost — more beneficiaries and rising cost per beneficiary, not just price increases. Trulicity and Ozempic lead the class.
The Report
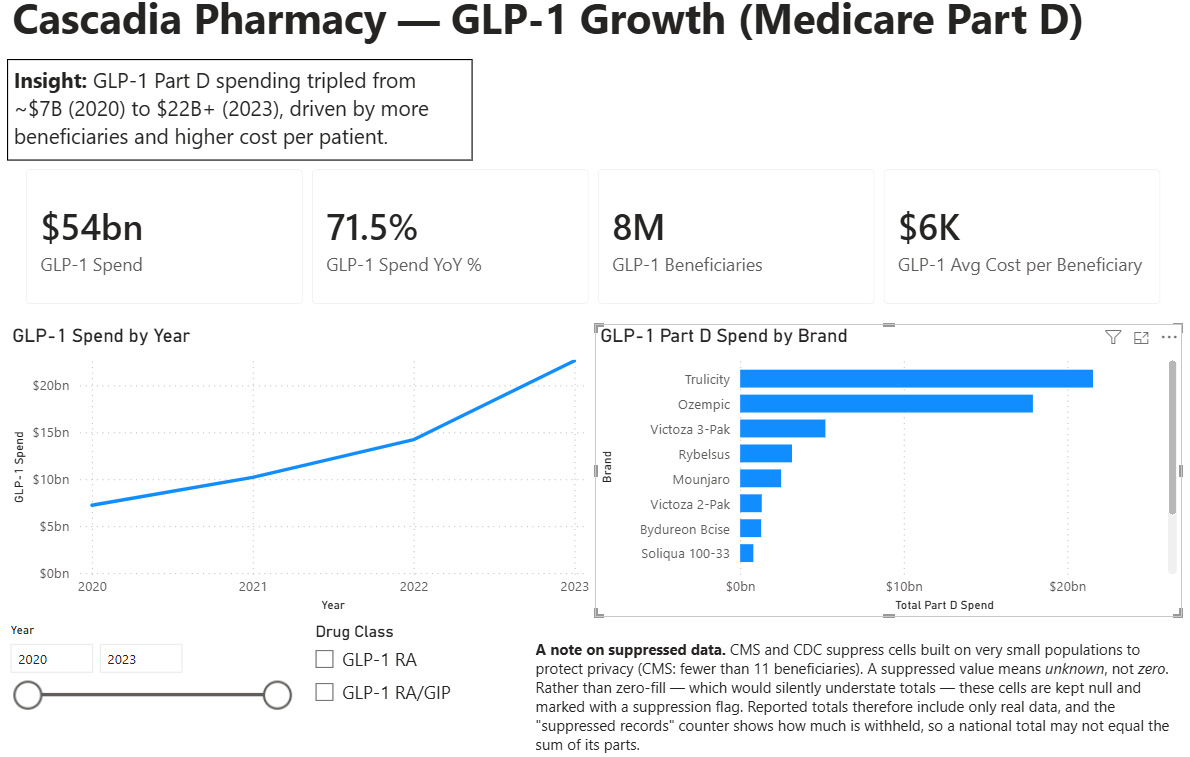
A recorded walkthrough is a planned enhancement.
Opportunities for Future Enhancements
- An Immunization Coverage & Access page (CDC VaxView) covering flu, RSV, and COVID adult coverage by state.
- A recorded walkthrough of the GLP-1 growth story.
Tech Stack
SQL Server 2025 T-SQL Python CMS Part D Data CDC VaxView Power BI DAX PowerShell