Cascadia Medical Devices
Predictive maintenance and OEE analytics on a 5.9M-row manufacturing dataset.
Manufacturing Analytics
Cascadia Medical Devices
Proving that a production-grade BI architecture scales from raw sensor data to boardroom OEE dashboards — in a single, reproducible build.
Overview
A full analytics stack for a fictional 3-line medical-device manufacturer, built on ~5.9M synthetic production events across 29 months, paired with real NASA C-MAPSS turbofan run-to-failure sensor data for predictive maintenance. It demonstrates dimensional modeling at scale, a medallion pipeline, and root-cause operational analytics.
Business Problem
Manufacturing leaders couldn’t see why on-time delivery was slipping on certain product lines. The data existed but was fragmented across systems with no single, trusted view.
Architecture
This build is the portfolio’s full enterprise-BI stack — the one Cascadia domain that runs end to end on Microsoft Fabric:
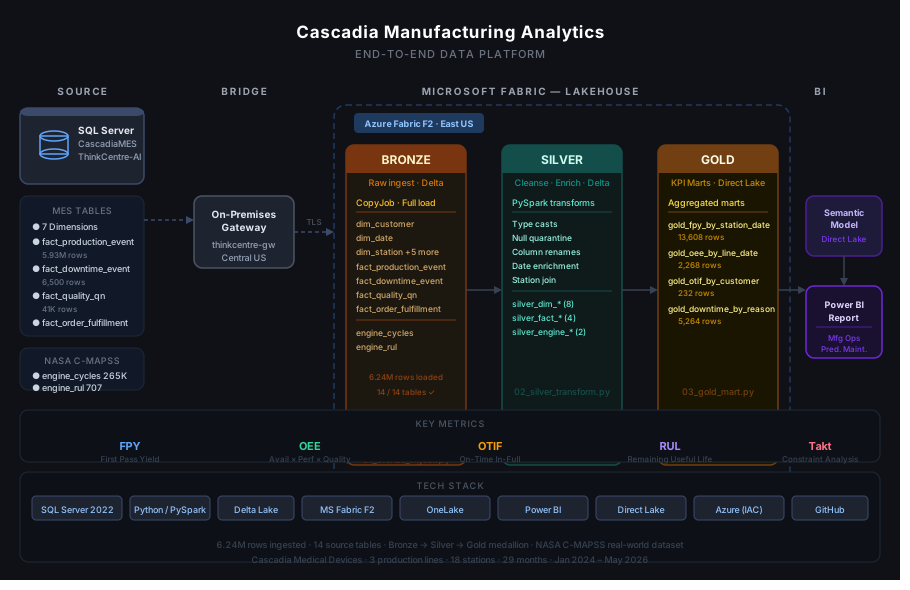
Source (SQL Server): CascadiaMES — star schema with 4 fact tables, 8 dimensions, dim_date, ~5.9M rows, plus a separate schema for NASA C-MAPSS sensor data. Loaded reproducibly via PowerShell; DP-600-aligned.
Pipeline (Microsoft Fabric): Bronze → Silver → Gold medallion lakehouse, implemented in PySpark notebooks.
Semantic model + report (Power BI): Direct Lake connection; DAX measures for OEE, MTBF, defect rate, and on-time-in-full delivery.
Data Sources
| Source | Type | Rows | Notes |
|---|---|---|---|
| CascadiaMES (simulated) | SQL Server | ~5.9M | Seed-controlled deterministic generator; 4 fact tables, 8 dimensions |
| NASA C-MAPSS | Public (NASA) | 265K cycles | Turbofan Engine Degradation dataset (FD001–FD004); cited and disclosed |
Headline Skill: Root-Cause Analytics & Predictive Maintenance
The dataset carries an engineered, discoverable story: a single station’s cycle time drifts up (≈58→69s), dragging First Pass Yield down on one line (≈95.5%→90.2%) and on-time-in-full delivery down on the affected product (≈92%→69%) — while control lines stay flat. The reporting isolates the root cause rather than just showing the symptom.
The NASA C-MAPSS layer adds a parallel story: remaining useful life (RUL) modeling on turbofan engine sensor data, surfaced as a reliability/maintenance planning view in the same report.
The Report
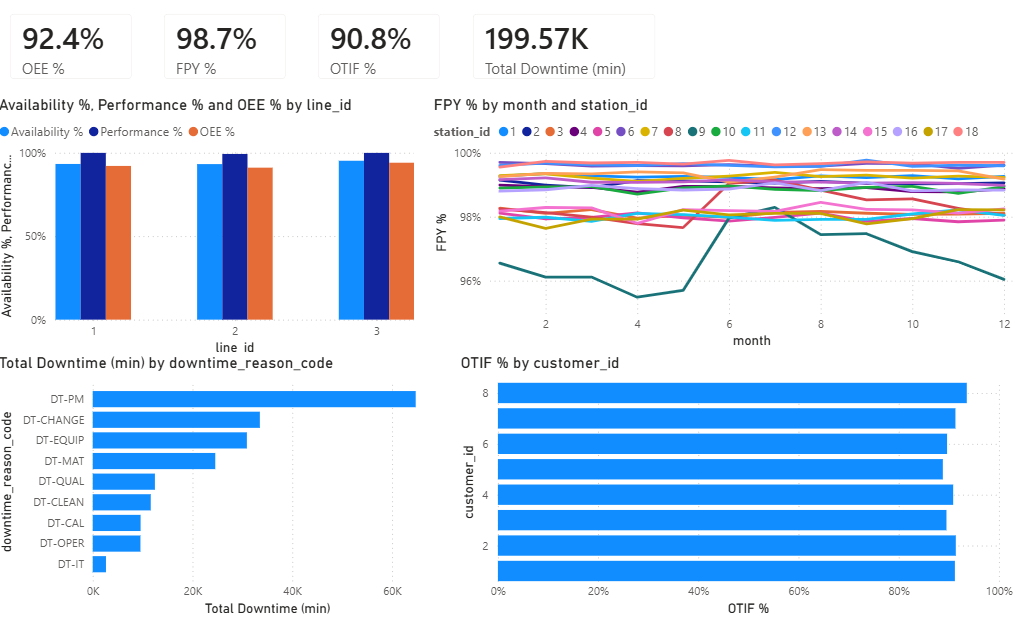
The Power BI report surfaces the OEE and root-cause yield story alongside the NASA C-MAPSS reliability / remaining-useful-life view.
Opportunities for Future Enhancements
- A recorded 3-minute walkthrough of the root-cause story.
- A Direct Lake performance writeup on the 5.9M-row model.
Tech Stack
SQL Server 2025 T-SQL Python (simdata) Microsoft Fabric PySpark Power BI DAX PowerShell
Links
- Build Repository — SQL DDL, data generation scripts, medallion notebooks
- Architecture Explainer — schema design decisions and data dictionary
- Cascadia Architecture Overview