The Cascadia Family
Different tools for different problems, one standard of rigor, governance, and honesty about data.
Cascadia is a portfolio of end-to-end analytics work: the data systems, and the metric and governance layers that decide what the numbers on top of them mean. The pieces do not share an architecture. They share a standard, and each uses the tools that fit its problem and its scale.
How I Built This
I set the architecture, the data model and the measurement definitions as a written specification. AI coding agents build to that specification in Python. I do not hand-write the Python. My role is to write the spec, review the output, and validate it.
Two controls stand over that arrangement, and every module passes both before it ships.
Every certified measure is validated independently against raw SQL. The check is written against the definition, not against the code that implemented it, so a published figure reconciles to source or the build does not ship.
Every chart is scored against a written visualization standard before it ships, including a blind reading panel: the reviewers see only the rendered chart, with no title and no framing from me, and report back what they think it says. The blind panel is my own addition to the standard.
What the builds are allowed to read is a boundary rather than a limitation. Three sources: the specifications, data models and standards written for these builds; public datasets from CMS, SEC EDGAR, NASA and BLS; and synthetic operational data, labeled as synthetic on every page that shows it. No confidential internal business data goes into any of it, deliberately.
One failure is worth naming, because it is the honest shape of an AI failure rather than the dramatic one. Bumping a version number across a build is the kind of mechanical edit that looks safe to delegate. Twice in two days an agent-executed bump left stale references behind, and the second pass corrected two of them while creating four more. Nothing errored. Nothing looked broken. Any check that only asks whether the code still runs would have passed all four times.
What catches it is grepping for the previous version before calling the bump finished, and then reading every surviving hit rather than counting them, because most surviving mentions of an old version are supposed to survive.
That control is still an instruction and not an automated check, and an instruction is precisely the control that had already failed twice. The automated version of it is written up as a proposal. It is not built.
The Builds & Their Stacks
| Domain | Status | Stack | Data | Headline Skill |
|---|---|---|---|---|
| Cascadia Revenue Assurance | Published | Python → flat CSV → static ECharts, with a DuckDB re-derivation gate | Synthetic (seeded generator): a subscription-licensing book, with no real company, customer or partner | Two derivation paths from one rules document, agreeing on every cell; the auto-renewed terms no transaction marked, derived and flagged |
| Cascadia Fee Examiner | Published | Python (stdlib) → flat CSV/JSON → static ECharts | LoPucki Bankruptcy Research Database, CourtListener RECAP, UTBMS/USTP Appendix B. Public court and research records (real) | Entity resolution across sources with no shared key; publishing what it can’t resolve |
| Cascadia Matter Ledger | Published | Python → DuckDB → static ECharts, plus a scheduled incremental pull | FJC Integrated Database and CourtListener RECAP. Public federal court records (real) | Operating a governed model: a pipeline that re-asserts its own invariants and publishes the failures |
| Cascadia Control Tower | Published | Python → DuckDB → dbt Core → static ECharts | Synthetic (seeded generator), anchored to BLS, Census and SEC XBRL | Metric certification / counterfactual costing |
| Cascadia Deal Desk | Published | Python → SQLite → static ECharts | Synthetic (seeded generator) | Pricing governance / exception calibration |
| Cascadia Finance | Published | Python → SQLite → static ECharts (SEC EDGAR XBRL) | FormFactor SEC filings (real) | Financial analytics / XBRL governance |
| Cascadia Staffing | Case Study | Local SQL Server → Power BI | CMS PBJ Daily Nurse Staffing (real) | Marketplace labor KPIs / metric governance |
| Cascadia Pharmacy | Case Study | Local SQL Server → Power BI | CMS Part D + CDC VaxView (real) | Messy-data cleaning / GLP-1 growth |
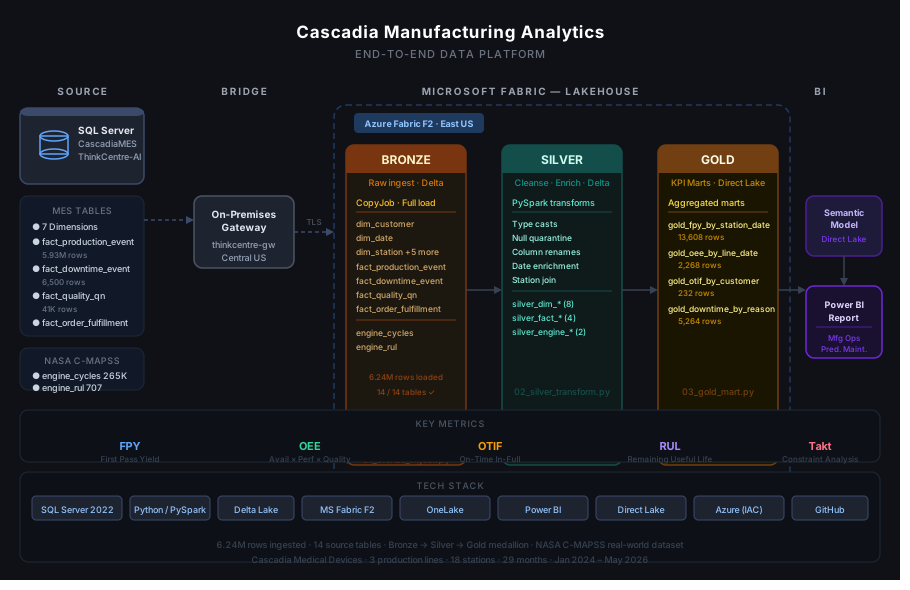
| Cascadia Medical Devices | Case Study | SQL Server → Microsoft Fabric → Power BI | Simulated MES + NASA C-MAPSS | Predictive maintenance / OEE |
| Cascadia Clothing | Planned | TBD | TBD e-commerce data | Customer segmentation |
Beyond the builds: Cascadia BI Migration is a program design for migrating an organization off legacy BI onto a governed, AI-assisted platform, with a certified metric layer at the center. It is the one piece here that is a program design rather than a data build.
Not a build at all: The Combinatorics of Sibling Conflict is a short mathematics paper, and a pet project. No stack, no data, nothing to put in the columns above. It counts the ways n children can split into two opposing sides: (3n − 2·2n + 1)/2, the Stirling number S(n+1, 3).
Three Patterns, One Standard
Lightweight analytical stack. Six modules need neither SQL Server nor Power BI: Deal Desk, Finance, Control Tower, Matter Ledger, Fee Examiner and Revenue Assurance. Python conforms the data into a local star schema and renders a static page with Apache ECharts, with the dataset inlined at build time so nothing fetches data at runtime. They circulate as a link with nothing to install, and they outlive the warehouse behind them.
Three of them take DuckDB, and for two different reasons. Control Tower and Matter Ledger take it for scale, at 621,942 order lines and 10,960,173 federal case records. Control Tower adds dbt Core on top, 6 staging views, 9 marts and 69 data tests, because its transformation layer is worth a real framework; Matter Ledger does not, because its modeling is a single conformance pass over a 2.0 GB file. What Matter Ledger adds instead is a live edge: a scheduled incremental pull that reconciles against the frozen baseline on every run. Revenue Assurance takes DuckDB for neither reason. Its book of 50,110 subscription-months would fit the smaller engine comfortably. It needed a second derivation path that could not share a bug with the first.
Cascadia Fee Examiner is the leanest variant and has no star schema at all. Python’s standard library does the conforming: no pandas, no database, nothing but hash-verified CSV and JSON, because the problem was never about row count. What it needed was a published rule for resolving firm identity across three sources that share no key, and a policy of publishing what the rule cannot resolve.
Pragmatic local stack. Pharmacy and Staffing run a local SQL Server star schema with a Python raw-to-clean staging layer, suppression flags rather than zero-fill, straight into a Power BI import model. Same discipline, no cloud overhead.
Enterprise-BI stack. Medical Devices is the full production pattern: a SQL Server star schema feeding a Microsoft Fabric medallion lakehouse, surfaced through a Power BI Direct Lake semantic model. A semantic model is not a hostable page, so unlike the modules above there is nothing here to open. The case study is where this build is shown.
Design Principles
Operated, not only built Most of these modules are frozen snapshots: pulled once, validated at build time, published. Cascadia Matter Ledger runs on a schedule, re-asserts its own invariants on every run, reconciles a live increment against the frozen baseline, and publishes the result, including when a run fails and why. A surface that has only ever shown green has demonstrated nothing.
Agreeing with yourself is not validation A second implementation that shares a helper shares its defects. Cascadia Revenue Assurance derives every published cell twice, by a state machine in Python and a set-based SQL path in DuckDB, each written from one rules document and neither from the other’s code. A hand-computed fixture of 15 cases was committed failing before either engine existed. If the two paths disagree the defect is in the rules document, and it is fixed there first. The module publishes no correctness percentage of any kind, by decision.
An audit that cannot fail is not an audit A realism check that has only ever seen good data has not been tested. Control Tower’s audits are pure functions of measured numbers, so the suite feeds each one deliberately wrong values: inventory inflated past the sector band, cost cut to a rounding error, splits made uniform. All six negative controls trip, and that result is published next to the real one.
Definitions live with the code that computes them A metric register typed by hand is documentation; one generated from the models is engineering. Cascadia Control Tower’s eleven-metric register is built from the meta blocks on the dbt models themselves, the same file that defines their tests, and a --check mode fails the build if a published definition drifts from the model behind it.
Publishing an unresolved case is not a gap; dropping one would be Where ambiguity is internal, the build fails: Deal Desk settles contested quote lines with three documented tiebreaks, and a tie that survives all three is a data-quality defect rather than a judgment call. Where it is external, failing would mean never shipping. Fee Examiner resolves 9 of 25 firm pairs across three sources that share no key, and publishes the other 16 with the reason each one did not match. A match rate near 100% would be evidence the rule is too loose.
Charts reviewed against a standard Every chart is scored pass or fail against my visualization design system before it ships, including a blind panel of readers who see only the rendered chart. Titles that claimed a figure the reader could not verify from the plot were rebuilt rather than re-worded.
Tech Stack
Python (pandas) SQLite DuckDB dbt Core Apache ECharts SEC EDGAR XBRL FJC Integrated Database Bankruptcy Research Database Playwright SQL Server 2025 T-SQL Power BI DAX Microsoft Fabric PySpark Static HTML / JS WCAG 2.2 AA target (unverified) GitHub Pages PowerShell Git